
Reading Time : 2 Mins
15 Best Tools for Business Intelligence in 2024
We have rounded up the top 15 business intelligence tools to make your search for the best tools much easier.
With truckloads of data being generated by every business out there, it would be a travesty if it were not used to find out deep insights about themselves. Using business intelligence tools, you can capture your data and present it in an actionable way which will pave the way for data-driven decision making.
There are great tools out there to help you with analytics, but what is the best one? Clearly they can’t all be number 1. Right? You just need to find the one that suits your particular business’ needs best.
So the question that comes to our mind is, “What are the top business intelligence tools?” While I don’t think you can really put it as a list per se, I will try to give you what I think are the top 15 tools for business intelligence. There is no way you will get every tool to make an official list, so I will just do a top 15 that comes from my experience and knowledge.
Why use business intelligence tools?
BI tools enable businesses to track and monitor their performance against set goals and targets. Dashboards and reports provide visual representations of performance metrics, allowing stakeholders to quickly identify areas of concern or success and take appropriate actions accordingly. Besides, most organizations often have data scattered across various systems and databases. BI tools help in integrating and consolidating data from different sources, creating a unified view of the organization’s data. This enables organizations to analyze data holistically and gain comprehensive insights.
Impacts of Business Intelligence tools on Businesses
Business intelligence (BI) tools have a significant impact on organizations across various aspects of their operations. Here are some key impacts of BI tools on organizations:
Informed decision-making: BI tools provide organizations with access to accurate and timely information, enabling them to make informed decisions based on data and insights.
Improved operational efficiency: BI tools help organizations identify inefficiencies, bottlenecks, and areas of improvement within their operations. By analyzing data and performance metrics, organizations can streamline processes, optimize resource allocation, and enhance operational efficiency.
Enhanced strategic planning: BI tools provide organizations with valuable insights into market trends, customer behavior, and competitive landscape.
Enhanced performance tracking and monitoring: BI tools enable organizations to monitor and measure key performance indicators (KPIs) in real-time. This allows them to track progress, identify deviations from targets, and take corrective actions promptly.
Improved customer understanding and satisfaction: BI tools help organizations analyze customer data, including purchasing behavior, preferences, and feedback. This deep understanding of customers enables organizations to tailor their products, services, and marketing strategies to meet customer needs more effectively.
Competitive advantage: BI tools provide organizations with a competitive edge by enabling them to analyze market trends, identify emerging opportunities, and respond quickly to changes.
Risk management: BI tools assist organizations in identifying potential risks and mitigating them proactively. By analyzing data and patterns, organizations can detect anomalies, identify areas of risk, and take appropriate measures to prevent or minimize negative impacts.
Let us look at the Top 15 Tools for Business Intelligence in the Market:

1. Microsoft Power BI
With this tool, you can analyze and visualize data from local or cloud sources, and publish the report to the BI platform. There are exciting features like visual-based discovery, interactive dashboards, data preparation, augmented analytics, etc. Unlike most of its competitors which offer access only on the web, with PowerBI, you can download the software, and run analytics in the cloud or through a reporting server.
It has a 60-day trial period that you could use before you make a decision. For a single user, Power BI is free and fully functional. The next version is called Power BI Pro which supports collaboration between different users and real-time data analysis.

2. Tableau
One of the most popular BI tools in the market right now, with Tableau, you can run its software on premises, use public cloud, or you can fully host it on the tool itself. Tableau has different versions for a variety of industries. Some of its capabilities include analysis of surveys, time series data, mapping, cleaning, and curation of data sources. It uses AI techniques of natural language processing where it allows users to describe what they want to see instead of having to use formulaic queries. Tableau is great for midsize and large enterprises.
Check out a comparison between Power BI Vs Tableau.

3. Oracle Analytics Cloud
This business intelligence tool was launched in 2014, and in 2020, they added a cloud HCM offering which will also provide self-service workforce analytics to analysts, C-suite executives, and HR executives. Oracle’s cloud offering is user-friendly and intuitive, and has powerful reporting and machine learning features. Some of the attractive features it possesses are visualizations, data connectors, data preparation, a native mobile app, predictive analytics, conversational analytics that supports natural language queries, and embedded analytics support.

Why Business Intelligence (BI) Can be Your Business’s Secret Weapon?
Have you ever asked the question why business intelligence (BI) is important for your business? Read this article to find out why and how to get started with Business Intelligence.

4. SAP Business Intelligence
It is an enterprise level business intelligence software for open client/server systems. The application that is developed using SAP can integrate with any system and provides highly flexible and transparent business systems. For easy setup and space utilization, it follows a modular concept. SAP BI provides the entire data to the user in an easy-to-understand format.
Its BI and ERP systems are easily integrated and function as a single unit. The system uses built-in performance optimization technology and a comprehensive life cycle that supports management. Thanks to its service oriented architecture, SAP Business Intelligence is easily scalable and it can work perfectly well for startups and multi-billion dollar organizations.

5. Oracle Hyperion
It delivers an integrated suite of applications that feature web and MS Office interfaces, mobile information delivery, reporting tools, and administration. Oracle Hyperion addresses your requirements across the entire length and breadth of your operation planning, master data management, consolidation, and close. It helps connect data across your entire organization so that you can build forecasts and use scenarios based on the changing conditions. With its built-in advanced analytics, you will be able to make better decisions.

6. SAS Business Intelligence
It allows users to leverage data and metrics which helps you make important decisions. The users have a lot of customization options available to them and it ensures high-level data integration, advanced analytics and reporting. Some of the other features include sentiment analysis that is used to understand the sentiment of users from social media and other places. Used mainly in larger organizations, it generates charts automatically, indulges in mapping and self-service data preparation.

7. Domo
This BI solution comprises multiple systems which are featured on this platform, which starts from connecting the data and completing it by extending data with pre-built and custom apps from its store. Like most tools for business intelligence, you can connect the data across your enterprise and leverage its AI and machine learning capabilities. It is possible to connect with more than 1000 pre-built cloud connectors, work on-premise, upload files, proprietary systems, etc. As soon as you upload your data source, you will be able to see it presented in the form of charts, graphs, and other types of visualizations. The Domo appstore is an ecosystem of pre-built apps, dashboards, connector APIs, etc.
Read more: 6 Best Practices To Use DOMO The Right Way
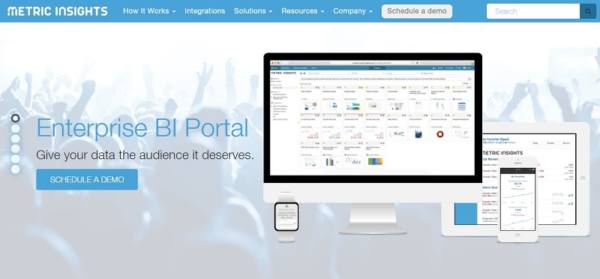
8. Metric Insights
This enterprise BI portal offers content organization, distribution of content under one point of access, anomaly detection, etc. The users can search and find BI content which is relevant to them and helps them in finding the right information. In the portal, the metrics, KPIs, dashboards, reports, etc., are consolidated in one place.
One of the most interesting features of this tool is its ability to manage alerts and ensure that one can act upon triggered data. Users can also create user-designed pages which feature highly relevant data. To make automation possible, it offers integration with chatbots of Slack and Microsoft Teams.

9. Microstrategy
This BI platform focuses on federated analytics, hyperintelligence and cloud solutions. The users can build interactive books of analytics which render on iOS and Android devices. Microstrategy’s Hyper Intelligence feature pulls data from various sources and provides relevant insights. It even provides you contextual insights, all you need to do is hover over the data.
Microstrategy also offers mobile deployment, thereby allowing users to take advantage of existing reports, dashboards, real-time visualizations, code-free app development, design, and more. Thanks to its natural language processing abilities, it is also possible to integrate voice technology. Its range of solutions delivers scalable, secure, and extensible cloud solutions which meet the business requirements.

10. QlikView
It is one of the BI applications that is offered by Qlik. Built on top of an Associative Engine, it allows for data discovery without having to use query-based tools which results in better output and reduces the risk of data loss. The Associative Exploration feature is based on simple selection and search functions which allows for easy operation to people of all levels of experience.
During the data exploration process itself, dashboards and guided analytics are highlighted for the user for their benefit. The Associative Engine combines all the data sources that you have without any differences, and updates with each click in the interface.

11. Dundas BI
Used mainly for creating dashboards and scorecards, it can also perform standard and ad-hoc reporting. The analysis and visualization of the data happens through a web interface which adapts to the ability of the user. Some of its newest features are in-memory engine, much improved natural language query capability, Linux support, point-and-click trend analysis, ability to make customized applications. It provides an immersive mobile experience where you can perform advanced data analysis on mobile devices.

12. GoodData
This BI tool provides tools for storage, data ingestion, visualization, analytics queries, application integration, etc. You can have their analytics engine embedded on desktop, website or mobile application. On the analytics front, you can scale as much as you want. It can be done with a wide range of customizations which allows customers to publish their own reports and dashboards.
GoodData provides an open platform for developers to provide you with frameworks that will allow you to integrate it with the existing data. It offers additional services as well as support for the complete data and analytics lifecycle which includes development, testing, launch and maintenance.

13. Board
It is a BI tool that combines BI, corporate performance management and business analytics. Board uses multiple data sources to create reports. In its unified and user-friendly environment, it offers a comprehensive set of features. They have a revolutionary in-memory technology called HBMP (Hybrid Bitwise Memory Pattern) which provides incredible speed to data visualization as well as the simulation and planning process. Its multi-layer security meets the rigorous security standards of enterprises.
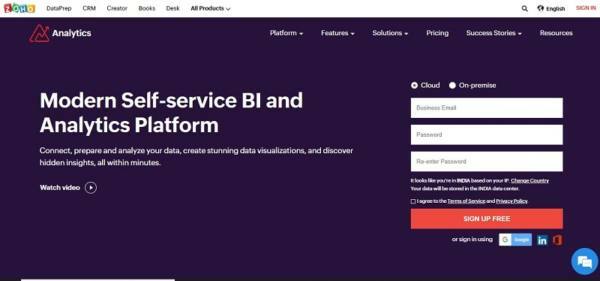
14. Zoho Analytics
It is a self-service BI and data analytics software which lets you analyze your data and helps you with stunning data visualizations. Zoho’s AI-powered assistant allows users to ask questions and get insightful answers that are presented in the form of attractive reports. It has a spreadsheet-like interface for data addition, analysis and reporting.
It is easy to connect with popular business applications in sales, marketing, help desk, HR, IT, Finance and through more ready made connectors. You can also leverage its powerful data import and integration APIs to build a connector quickly. Zoho Analytics even allows you to blend and merge data from different sources that will help you create meaningful business reports.

15. Yellowfin BI
This BI analytics tool offers a plethora of features and has five main products to connect, transform and understand the data that your business holds. They are specialized in enterprise analytics, embedded analytics, and analytical application builders. Yellowfin automatically detects trends or any anomalies in your data, thanks to its powerful algorithms, it will immediately send personalized notifications to your smartphone. It provides persuasive data stories which helps people build data reports.
Benefits of BI tools for Businesses
- Enhanced customer intelligence and personalization
- Regulatory compliance
- Data security and privacy
- Fraud detection and prevention
- Compliance and regulatory reporting
- Performance tracking and benchmarking
- Market intelligence and competitive advantage
- Data integration and consolidation
- Predictive analytics
- Self-service analytics
- Enhanced collaboration and data sharing
Conclusion:
Big data has been a buzzword for quite some time and its relevance is only going to increase every year. With the help of Business Intelligence tools, your data management will improve. Going the manual route is not only passé, but it is also highly ineffective if you are serious about leveraging your data. BI tools also keep dynamically changing based on your business requirements and the prevailing market conditions.
If you want to build a dashboard that will change how your business uses data, Zuci Systems can offer its data visualization consulting services and become your reliable partner. Let us make your business more efficient and smarter and put you in the best position to keep achieving your business goals.
Read Next:
Frequently Asked Questions

I write about fintech, data, and everything around it | Assistant Marketing Manager @ Zuci Systems.
Share This Blog, Choose Your Platform!
Related Posts


